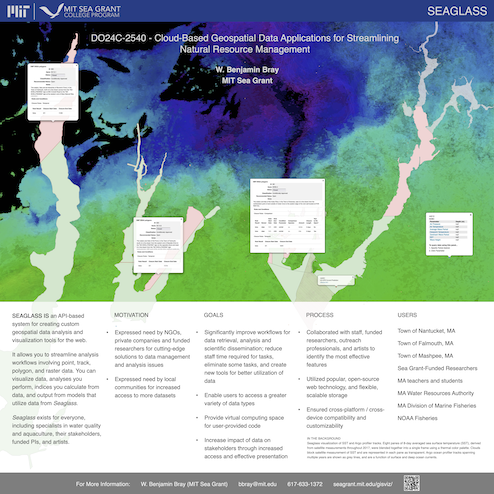
MIT Sea Grant provides GEOSPATIAL DATA services and guidance to scientists, engineers, outreach specialists and educators.

  • GEOGRAPHICAL INFORMATION SYSTEMS (GIS)
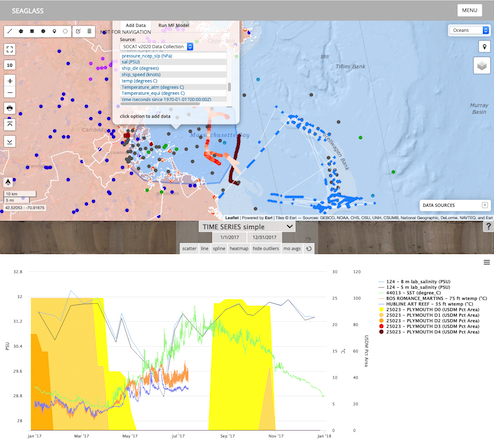
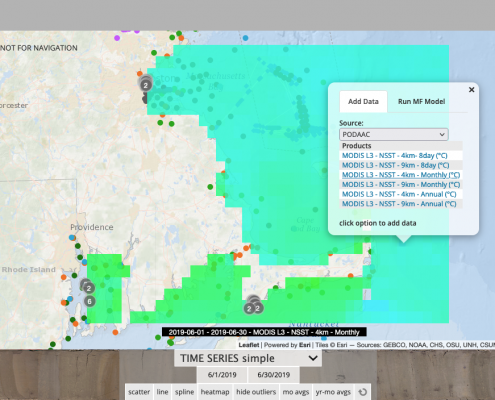
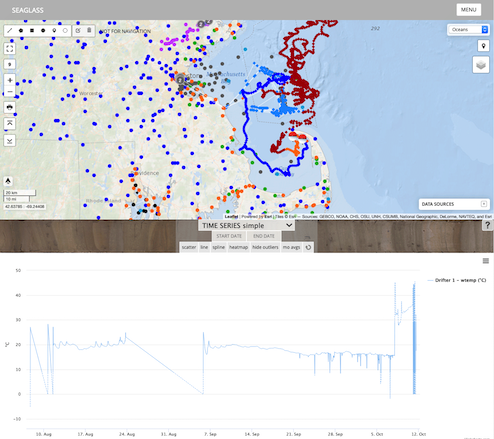
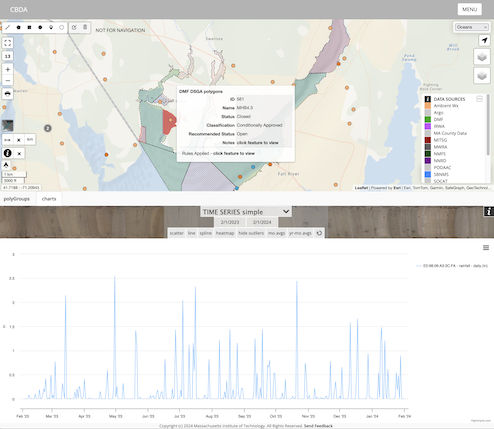
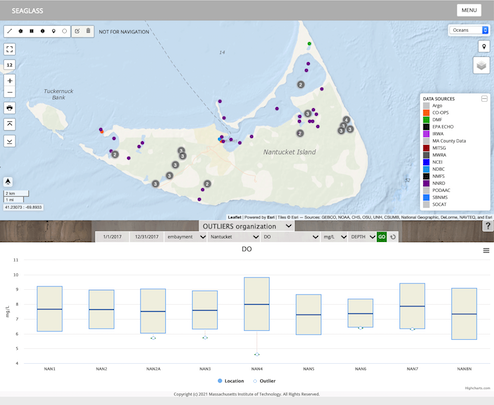
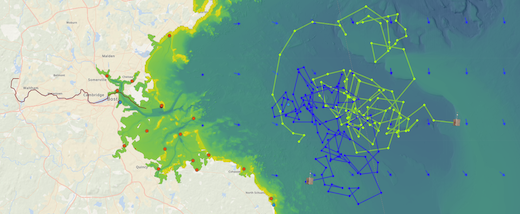
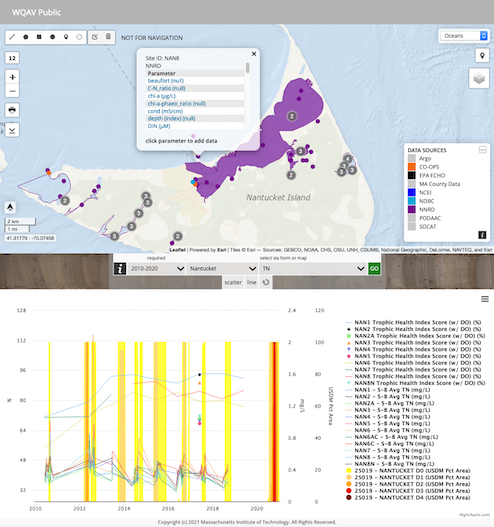
  • DATA VISUALIZATION
  • DATABASE DESIGN
  • WEB-BASED GEOSPATIAL APPS
  • REMOTE DATA ACCESS

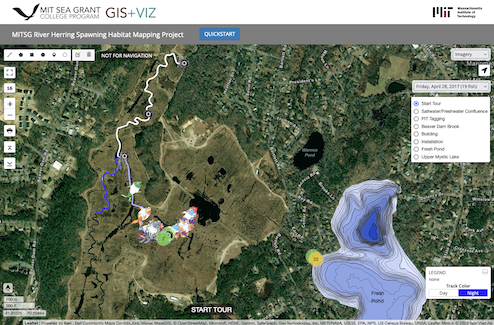
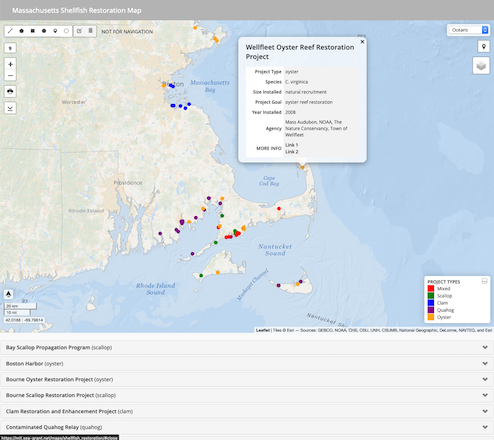
MITSG GIS+VIZ helps stakeholders work with geospatial data using the most modern methods, and take advantage of recent improvements in data storage, data service and API accessibility, web technology, and user interface design. Our methods support the democratization of data in the public realm, as well as innovation in how scientists access and use data.

CONTACT US

MIT Sea Grant is eager to work with stakeholders on projects involving geospatial data in the Gulf of Maine region. If you have a specific proposal in which you would like to involve MITSG GIS+VIZ, or a suggestion for future collaboration on proposal(s), PLEASE CONTACT US.

Proposals may include:

  • spatial planning
  • database management
  • geospatial data visualization, analysis and modeling
  • web-based geospatial applications

Ben Bray's staff photo

BEN BRAY

Web Developer

(617) 252 – 1675 (offce)
(617) 633 – 1372 (cell)

bbray@mit.edu

PORTFOLIO

SEAGLASS

SEAGLASS provides a comprehensive, mobile-friendly environment for data management, visualization, analysis, modeling, and download.

This system utilizes a dynamic and flexible ensemble of DATA SOURCES, including its own internal database to which users can UPLOAD their data, that responds to the needs of the user. External data source APIs include both Eulerian platforms and Lagrangian platforms, including buoys, drifters, ship tracks, fixed sensors, as well as mapserver layers and raster data from satellites.

Data may be VISUALIZED and ANALYZED via the interface form and/or map.

In addition to visualizing data, the system also supports index calculation, MODELING visualization, using either the host server or external, high-performance servers. Calculated input can be visualized in the system real-time.

All visualized data and modeled output can be DOWNLOADED from the system on-the-fly as tabular or graphical files.

SEAGLASS is available for demonstration by clicking the button below, then clicking the ‘DEMO’ button in the interface login page to auto-populate the login credentials.

OBJECTIVES

  • Significantly improve workflows for data retrieval, analysis and scientific dissemination; reduce staff time required for tasks, eliminate some tasks, and create new tools for better utilization of data.
  • Enable users to access a greater variety of data types.
  • Increase impact of data on stakeholders through increased access and effective presentation, using mobile-friendly frameworks.
  • Streamline sharing of data between environmental organizations for municipal storage, processing, research and analysis of data.
  • Allow scientists to see and download data to analyze long-term trends, to better support management decisions.
  • Provide virtual computing space for user-provided code.

MOTIVATION

  • Expressed need by NGOs, private companies and funded researchers for cutting-edge solutions to data management and analysis issues
  • Expressed need by local communities for increased access to more datasets

PROCESS

  • Collaborating with staff, funded researchers, outreach professionals, and artists to identify the most effective features
  • Utilizes popular, open-source web technology, and flexible, scalable storage
  • Ensures cross-platform / cross-device compatibility and customizability

COLLABORATORS

Town of Nantucket, MA
Town of Falmouth, MA
Town of Mashpee, MA
Massachusetts Water Resources Authority
Stellwagen Bank National Marine Sanctuary
Massachusetts Div. of Marine Fisheries
Sea Grant-Funded Researchers MA teachers and students
NOAA Fisheries

VIEW DATA FROM VARIOUS SOURCES

SATELLITE DATA

BUOYS, DRIFTERS, AND MORE

POLYGON, RULES, CONDITIONS MANAGEMENT

BUILT-IN ANALYSIS TOOLS

Cloud-Based Data Applications for Streamlining Natural Resource Management

OBJECTIVES

  • Increase awareness among natural resource managers of relevant data that’s available to them, in ways they’re not familiar with
  • Help natural resource managers use data to make better decisions more quickly through modern data visualization
  • Provide relevant information to stakeholders (e. g. permit holders, managers) in ways they can utilize quickly

FEATURES

Rules and condition management – Allows administrators to manage rules per polygon for closure station, with each rule comprised of whatever conditions the administrator wishes to apply

Rule propagation among multiple jurisdictions – lists the hierarchy of jurisdictions that govern evaluation of rules that result in a polygon’s recommended status

Rule evaluation based on real-time environmental data – query rainfall data real-time via integration of the Ambient Wx API, leading to streamlined workflows for administrative decision-making, and faster, more transparent interaction with shellfishing permit holders

Polygon management – add, delete, edit, and VERSION shellfishing embayment shapes, in response to changing social and environmental conditions

Incorporates core Seaglass data visualization interface, allowing administrators to view embayment data in the context of other parameter groups, such as water quality and atmospheric data, including all of the APIs that Seaglass is connected to

DOWNLOAD POSTER

presented at AGU Ocean Sciences Conference – February 2024

WQAV – Public

Developed through collaboration between the Nantucket Natural Resources Department (NNRD) and MIT Sea Grant, the Water Quality Analysis & Visualization (WQAV) public interface brings the essential elements of water quality to the public.

The objective of this collaborative project is to increase clarity of water quality information to public by facilitating easy, engaging access to local water quality, and encouraging interest and active involvement in protecting harbors and ponds. This collaboration involved discussions between NNRD and MITSG staff, and multiple phases of focus group surveys and evaluation.

The full-featured WQAV interface and WQAV Public interface are organization-specific derivatives of the SEAGLASS system developed by Ben Bray (MIT Sea Grant).

WEBINAR

On June 11, 2021, Nantucket Natural Resources Department (NNRD) and MIT Sea Grant (MITSG) teamed-up with NCTV18 in Nantucket to host an introductory webinar marking the launch of the WQAV Public interface and the WQAV system, used by NNRD.

WATCH THE WEBINAR on YouTube!

WQAV ON THE RADIO

On June 2, 2021, Ben Bray (MIT Sea Grant) talked with Andrew Cromartie of ACK97 FM about the WQAV system, including its collaborative development, goals of the system, and plans for future development.

LISTEN ON: SPOTIFY~APPLE PODCASTS~SOUNDCLOUD

DOWNLOAD POSTER

presented at AGU Ocean Sciences Meeting – February 2020

MITSG River Herring Spawning Habitat Mapping Project

Declines in river herring landings over time support the need for:

  • Coast-wide population assessments
  • Habitat and fish passage restoration and assessments
  • Increased awareness for the status of river herring and resource requirements

Resource managers are typically presented with difficult to interpret figures and very large data sets to mine for useful information.

Through collaboration with Dr. Rob Vincent (MIT Sea Grant), we developed a web application that provides easy to interpret visualization of the data, with access to underlying data sets.


Our application can also be seen in “Downriver and Out to Sea: Sea Grant Stories of Sea-Run Fish“, a collection of stories by Tim Briggs (NH Sea Grant), about sea-run fish and the Sea Grant researchers working to understand and protect these ecologically vital species.

USERS

Fisheries resource managers
Restoration planning and design engineers
Fisheries Ecologists
Citizen Science Program
Educating School Groups and the General Public

CRAB and MIT Sea Grant Chart of the Lower Charles River

Charles River Alliance of Boaters (CRAB) developed a partnership with the MIT Sea Grant to create a chart of the river depth between the Charles River Dam and the Watertown Dam, and to monitor changes in the river bottom in the future.

Detailed Project Description : VIEW

Massachusetts Shellfish Restoration Map

All data for this project was compiled by Rebecca Cox (Environmental Studies, Wellesley College ’22) as part of the MIT Undergraduate Research Opportunities (UROP) Program.

Through collaboration with Dr. Carolina Bastidas (MIT Sea Grant) and GIS+VIZ, this information was integrated into SEAGLASS and presented in a custom interface.